NEV is one of two measurements that ALM modeling uses to assess your interest rate risk. NEV stands for net economic value and is sometimes referred to as the economic value of capital at risk. NII represents net interest income, sometimes referred to as the income simulation. In this article, we’ll define NEV and discuss examples of how to read the measurements.
Net Economic Value is the fair value of assets minus the fair value of liabilities, following the accounting equation to assess the fair value of capital. Fair value (or market value) can easily be understood as the relative attractiveness of the balance sheet items compared to a related alternative. This is often expressed as price-to-book. Selecting and tuning those alternative indexes is one of the finer nuances of ALM modeling.
The rate to which you are comparing your balance sheet items is called the discount rate. For example, you might consider modeling member certificate deposits against the rates offered for wholesale funding at a corporate credit union or the FHLB, because you can very easily match up the terms of the funding sources and compare rates.
Some ALM users struggle to connect the implications of NEV to strategy. However, NEV analysis is perhaps one of the most important measurements of interest rate risk, because it models all balance sheet instruments to final maturity, giving the credit union an idea of the long-term risk exposure. Let’s break down the two components:
Fair values are often expressed as a price, just like you would see a premium or discount price on a bond investment.
For assets,a gain-to-book (premium, price above 100) is desirable, because the assets represent a balance sheet item that generates revenue. In simple language, if you have a price above 100 on assets, that often indicates that the yield is attractive compared to current rates on similar assets.
For liabilities, a loss-to-book (discount, price below 100) is desirable, because liabilities are things for which the credit union pays a rate. If you have a price below 100, it often indicates that the cost of funds for the credit union is below average.
Let’s take a look at how to read this on an ALM report in the chart below. Here we see a high-level summary balance sheet, with the different account types rolling into assets and liabilities. There are three columns to the right, Book value – which is the value of the balance sheet item at the price you paid, Base NEV which is the current calculated fair value, and Price-to-Book. Price-to-book very simply is the Base NEV divided by Book Value.
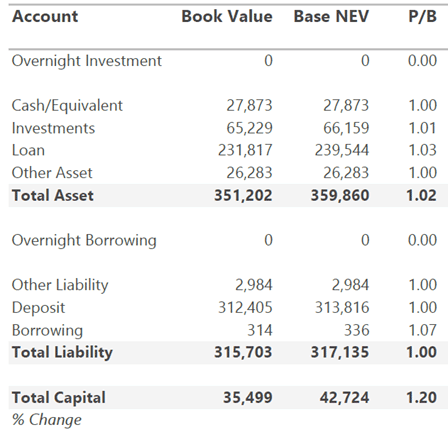
We can see for this balance sheet that the price-to-book of total assets is 1.02 which means that on average, their assets are yielding more than current market rates. Meanwhile the price to book on liabilities is 100, or par price, which means that their cost of funds is in line with the market average.
Because NEV is the difference between the fair values of assets and liabilities, the final line shows a price-to-book of capital at 1.20, indicating that the balance sheet has an attractive valuation as it stands today. That tracks with previous assessments, because earning an above-average yield on assets that are funded with market funding should result in profitable margins over time.
Fair value assessments can change because 1) the composition of the balance sheet changed or 2) market rates changed. ALM Models typically perform static balance sheet simulation which means that it is only simulating market rate changes. However, changes to the balance sheet will show up in quarter over quarter comparisons.
Now that we have covered the basics of how NEV is calculated, we can shift to how it relates to interest rate risk. In the table below we see an example of a list of shocked NEV scenarios, following an array of a downward 3% shock all the way to an upward 4% increase. You can see that NEV declines by a greater degree in each of the upward rate shocks.
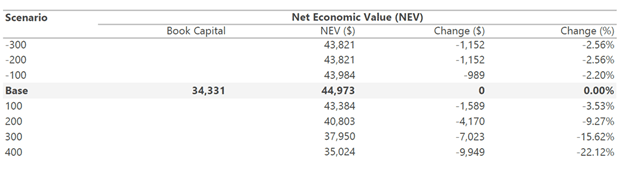
This is because the relative attractiveness of assets on the current balance sheet would decline more quickly than that of liabilities. For example, a pool of loans with a 4% yield may look great today, but it would be less attractive if prevailing rates on the same type of loans was 5, or 6, or even 7%.
The column on the right measures the percent change in NEV, which is calculated as the dollar change divided by the base case NEV. In simple terms, how much did the relative attractiveness change from the base case where rates staying the same.
This sensitivity measurement is important because it is one of the metrics for which balance sheet managers use to set strategy, and it’s one of the required risk limits for ALM policy.
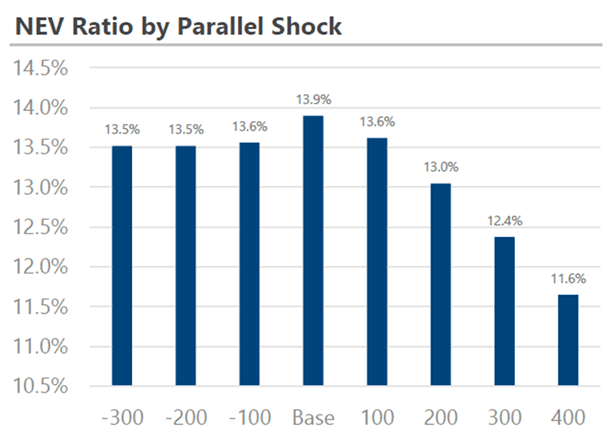
NEV is also used to calculate the NEV ratio, which is simply NEV divided by total assets. This should sound familiar to the capital ratio, one of the main strategic ratios of balance sheet management. Really this is the same calculation as above, but we’re assessing how it would impact the capital ratio. This simulation answers the question, “if rates changed and we changed nothing on the balance sheet, how might our capital ratio look?”
To learn more about how Accolade can help your credit union assess interest rate risk, contact us today.
By Phil Lucas